July offer: Start with 14 days free today --d--h--m--s

Find Better Stocks Using
Data-Driven Analysis.

Find Better StocksUsing Data-Driven Analysis.

Stock Analysis With a Track Record.

Get Access
Start with 14 days free|Find better stocks in 60 seconds

▶ Watch the demo

Interactive demo
Swipe features
DAISY Analysis

See any stock's exact valuation. Our trained AI analyses each one.

Microsoft CorporationMSFT

Stock Summary

Powered by DAISY
Cloud & AI Stalwart
Large-cap cloud and AI stalwart with diversified software and services; strong profitability, cash flow and margins; near-term legal scrutiny over Copilot and internal inventory warnings.
Sector: TechnologyIndustry: Software - Infrastructure
HelloStocks Score

Focus on better stocks with our unique scoring system

Microsoft CorporationMSFT
HelloStocks Score
Overall Rating
7.9
Growth
7.8
Financial Strength
9.4
Value
6.7
Fundamentals

See how fundamentals compare to industry and sector competitors

Microsoft CorporationMSFT

Financial Strength

Metricvs Sector
Gross Margin: 67.6%High (top 69%)
Operating Margin: 46.8%Very High (top 98%)
Net Margin: 39.3%Very High (top 96%)
ROE: 33.1%High (top 74%)
ROA: 19.2%Very High (top 87%)
ROIC: 29.0%High (top 74%)
Free Cash Flow (TTM): 72.9 billionVery High (top 100%)
Debt to Equity: 0.14Low (bottom 37%)
Book Value / Share: 55.80Very High (top 94%)
Financial Strength Score: 9.4Very High (top 96%)
Earnings Audit

Avoid misleading earnings with AI normalized results for each stock.

Microsoft CorporationMSFT

Earnings Audit

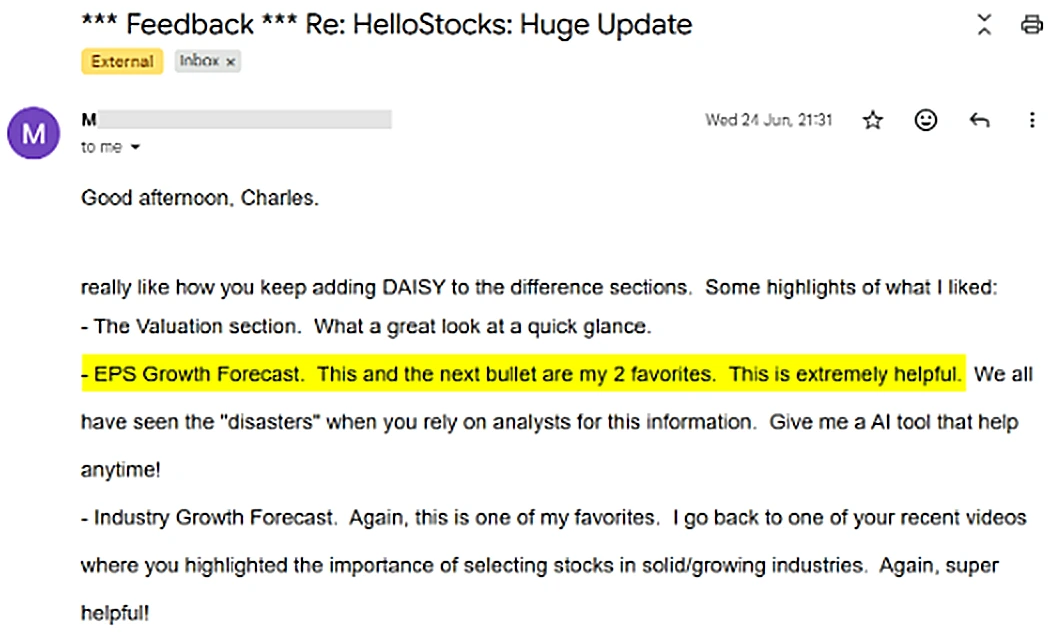
DAISY uses saved SEC-backed normalized EPS data. You can remove, add back, or edit adjustment items to see how EPS, P/E, and PEG change.
DAISY
Your AI Earnings Auditor
Suggested Normalized EPS
16.19
Adjusted for one-time items
GAAP EPS
16.8
DAISY Summary
Over the latest four quarters, normalized EPS is 16.19 versus GAAP EPS of 16.80. The main adjustments identified from SEC filing reconciliations were openai investment impact.
DAISY Explanation
Adjustments Made (TTM total)
  • +OpenAI investment impact+0.41
  • -OpenAI investment impact-1.02
Quarterly EPS Breakdown
QuarterPeriod EndGAAPAdj DilutedAdj BasicDAISY
Q1 2026Mar 31, 20264.27--4.27
Q4 2025Dec 31, 20255.16--4.14
Q3 2025Sep 30, 20253.72--4.13
Q2 2025Jun 30, 20253.65--3.65
TTM16.816.8-16.19
Valuation Station
Adjust values to effect the valuation metrics
editable
Market: 395.63
editable
Reported: 16.80
editable
Base: 17.07%
%
calculated
24.44
Base: 23.55
PEG Ratio1.43
Fair
01234+
LowFairPriceyHigh
What is the PEG Ratio?

The PEG ratio combines price-to-earnings with expected earnings growth to assess value.

Formula: P/E Ratio divided by expected annual earnings growth %

Industry Outlook

Understand the wider industry growth with AI analysis and growth expectations.

Microsoft CorporationMSFT

Industry Outlook

DAISY OutlookAI cloud growth still rising
Powered by DAISY

Companies are still spending on AI infrastructure, cloud migration, and automation, but they are also checking software bills more carefully.

Long Term Annual Industry Growth
Low 11%High 25%
DAISY expects: 18%

Macro Environment

Mixed

The backdrop is mixed but still supportive for infrastructure software. AI data-center buildouts, new capital-spending incentives, and ongoing cloud migration are helping demand. The pressure point is renewed inflation risk from overseas conflicts, which can keep borrowing costs higher and make finance teams tougher in software renewals.

Competitive Dynamics

Expanding

Competition is still expanding as large platforms add more AI, data, and security features into existing bundles. Specialists can still win when they solve urgent problems, but they have to prove why customers should add another vendor. Scaled players should protect margins better, while smaller entrants may need to spend heavily on product and sales.

Growth Outlook

Expanding

The near-term growth path still looks healthy. AI features are moving from demos into daily business work, and that keeps demand firm for cloud platforms, data tools, security software, and automation. Customers are not buying every tool they see, though, so vendors need to show clear savings or revenue gains to keep projects moving.

Key Near-Term Risks

Elevated

The first risk is that AI projects do not deliver clear savings or revenue fast enough, causing customers to slow deployments. The second is cloud cost control, because customers can cut unused capacity, delay migrations, or renegotiate contracts when bills rise faster than budgets. The third is a major cyberattack or tougher data-location rule that forces slower rollouts in regulated industries.

AI-generated content may be wrong; please perform your own research

Updated Jul 12, 2026
Strategy Match

See whether the stock fits the investing rules and filters you care about.

Microsoft CorporationMSFT

Strategy Match

See how this stock aligns with your saved strategies.

1 strategy matches
My Growth at a Reasonable Price Strategy
Durable growth and reasonable valuation.
8 / 8100%
Financial Powerhouses
Margins, cash flow, and balance sheet strength.
7 / 888%
Low Valued Fast Growers
Growth with valuation discipline.
5 / 771%

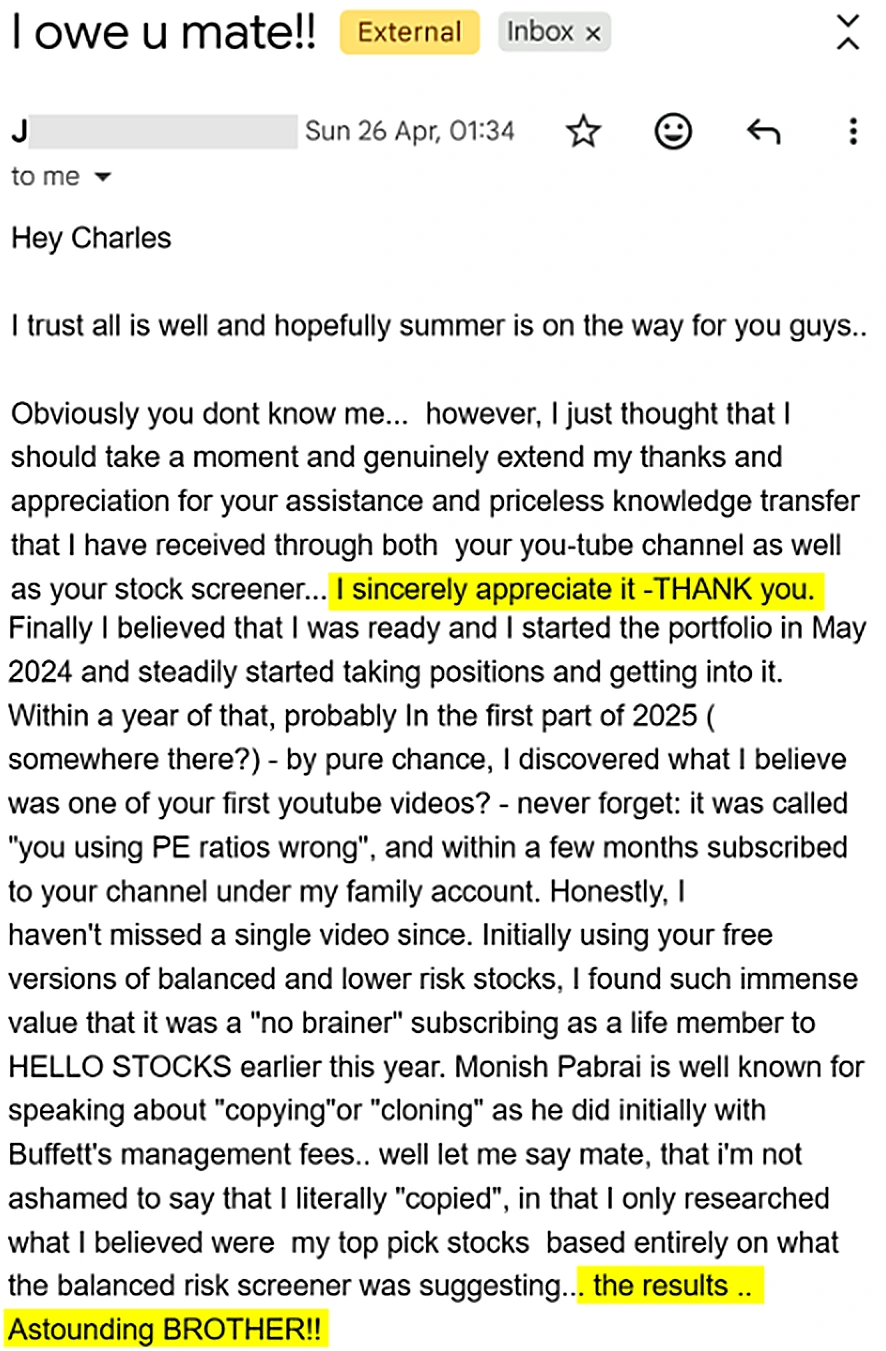
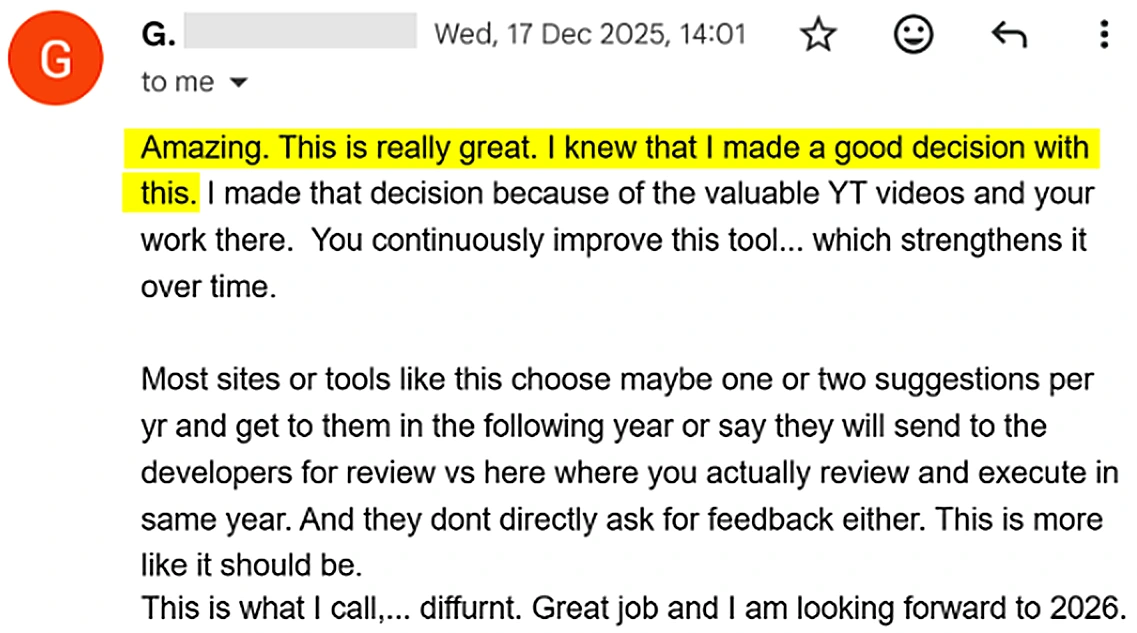
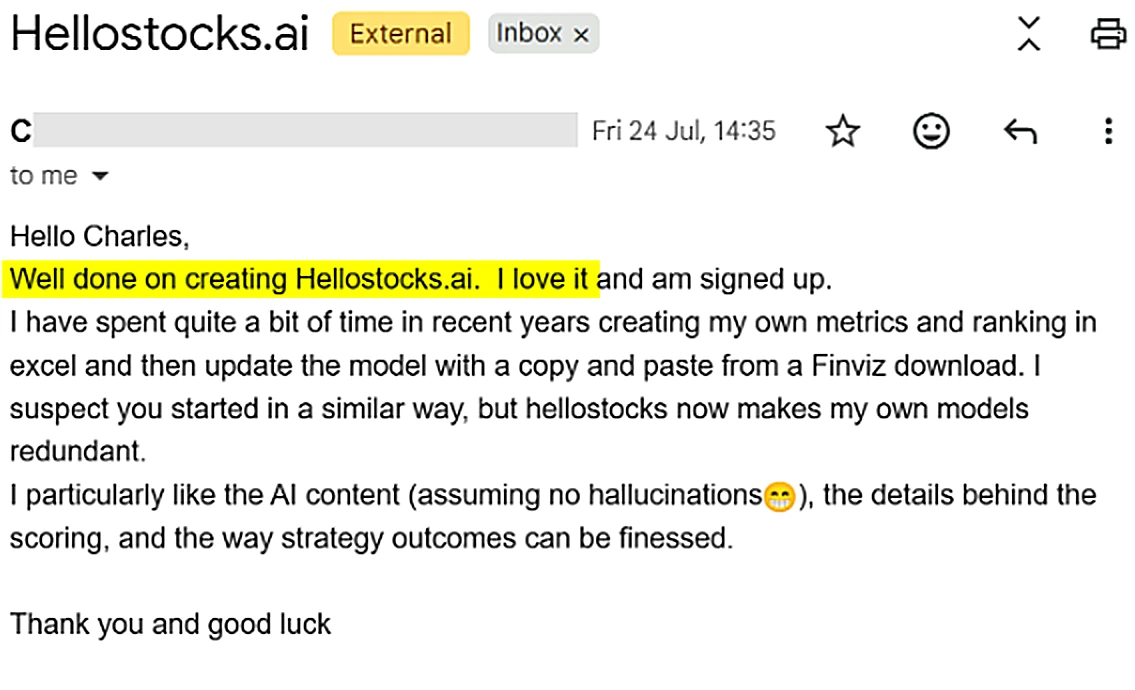
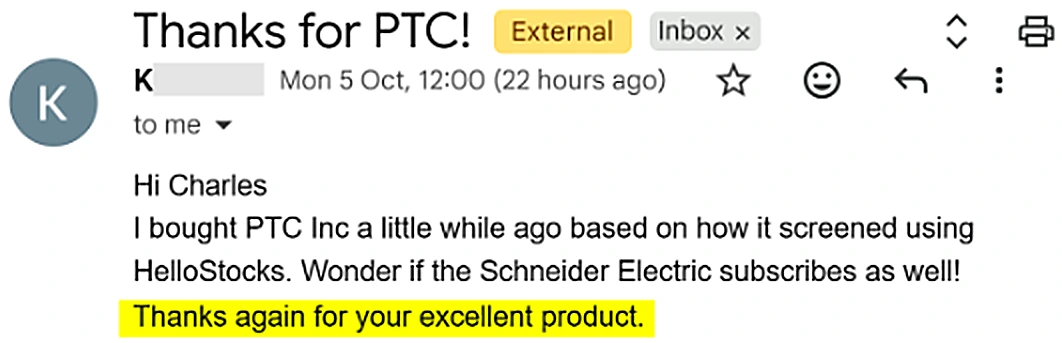
They Stopped Guessing.Now They Pick with Clarity.

Join hundreds of home investors who've transformed their approach.

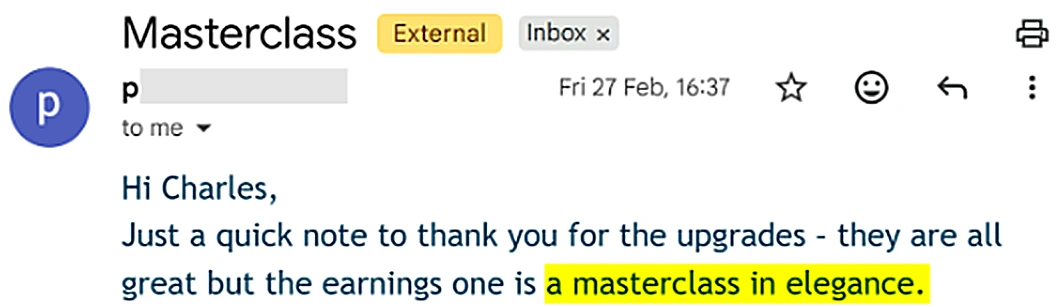
Distills a lot of information into a simple framework focussed on what works. Simple is not simplistic - there are the AI enhancements that really add value. The constant upgrades are based on actual feedback that is open for all to see as well. I was an early user and have been so impressed by the constant improvements that I bought subscriptions for my two kids.

Phil

User since Oct 2025

Our Top Scoring Stocks Are Beating The Market

HelloStocks score 8-10

+23.3%

Return since October 2025

49 stocks currently tracked

Updated yesterday, 15th July

vs

S&P 500

+16.5%

Return since October 2025

Market benchmark

Past performance does not guarantee future results. Equal-weighted index with stocks entering at market open on qualifying date. Sourced from US top 500 stocks.

Our Top Stocks
Are Beating the S&P 500
5,000+
US Stocks Scored on One Method
Founder-Led
Personal Support From Charles
Weekly
Updates From User Feedback

A Note From the Founder

Charles, founder of HelloStocks

I've worked in data analytics and data engineering for over a decade, and I've been building stock market analysis tools for the last 8 years. HelloStocks started as a tool I built for my own investing, using past data trends which had consistently helped identify better opportunities. Once I began sharing my analysis on YouTube, people asked to use it, so I opened it up and kept building.

If you have questions, email me. I read every one.

Charles

Founder, HelloStocks

What Makes This Different

Built Around a Method,
Not a Pile of Data

Trained on Our Method

Meet DAISY, an AI Analyst With Standards

Every finance app has a chatbot now. DAISY is different: she is trained on our bespoke methodology. She audits reported earnings and adjusts for one-off events like tax events, flags warning signs, researches industry outlooks, and builds strategies from a plain-English description.

  • Audits earnings and adjusts for one-off events
  • Analyses earnings calls & flags warning signs
  • Builds strategies from plain-English descriptions
DAISY - AI Strategy Builder

Find me undervalued tech stocks with strong earnings growth and low debt

DAISY

I've built a strategy with these filters:

Sector:Technology
P/E Ratio:Below Industry Avg
EPS Growth:> 15% YoY
Debt/Equity:< 0.5

✓ 23 stocks match this strategy

DAISY Valuation

See What a Stock Is Actually Worth

Every stock page opens with DAISY's valuation. She weighs true earnings power, growth potential, quality, financial strength, industry dynamics and warning signs to set a fair value range, then shows you exactly where today's price sits on it.

  • Fair value band built on true earnings power
  • Today's price plotted from Worryingly Cheap to Expensive
  • Quality, risk and business type all priced in
DAISY Valuation
Fairly Valued

Fair value band $86 to $112

$94
Worryingly CheapUndervaluedFairly ValuedPriceyExpensive

Deep Analysis

Every Metric, Ranked & Explained

See how any stock compares to its industry peers across 50+ metrics. Color-coded from red to green, labeled Very Low to Very High. Understand any stock at a glance.

  • Industry & sector rankings
  • Color-coded metric bands
  • Historical trend tracking
Stock Analysis - MSFT
MSFT
Technology · Software-Infrastructure · NASDAQ
HelloStocks Score
7.9
7.3
Growth
9.6
Financial Strength
6.7
Value
Company Metrics - Compared to Sector
Revenue Growth (1Y, TTM)16.7%
Medium (top 54%)
Operating Margin46.7%
Very High (top 98%)
ROE33.6%
High (top 75%)
Debt / Equity0.15
Low (bottom 38%)
P/E Ratio25.31
Medium (bottom 43%)
Sentiment

Market Mood at a Glance

Our proprietary Fear & Greed model scores every industry from 0 to 100. See which sectors are overheated and which are unloved - all in a single heatmap updated daily.

  • Proprietary Fear & Greed score per industry
  • Color-coded heatmap across all sectors
  • Spot rotation and sentiment shifts early
Industry Mood Heatmap
AllTechnologyHealthcareFinancialEnergy
Semiconductors
82
Extreme Greed
Software
71
Greed
Internet Content
68
Greed
Drug Manufacturers
65
Greed
Auto Manufacturers
52
Neutral
Banks - Regional
38
Fear
Oil & Gas E&P
41
Fear
Asset Management
50
Neutral
Medical Devices
58
Greed
REITs - Retail
22
Extreme Fear
Aerospace & Defense
61
Greed
Telecom Services
45
Neutral
Consumer Electronics
73
Greed
Utilities - Regulated
34
Fear
Restaurants
56
Greed
Extreme Fear
Fear
Neutral
Greed
Ext. Greed
Market Intel

Daily Briefs, Powered by DAISY

Every morning, DAISY combines AI-driven news analysis with market data to give you a concise brief - so you know what matters before the market opens.

  • AI-curated market outlook each morning
  • Key industry trends with reasoning
  • Actionable insights, not just headlines
Discover — DAISY Daily Brief
DAISY Daily Brief
Wed Mar 4
Market Outlook

Markets are showing resilience despite mixed economic signals. Tech continues to lead on strong AI spending, while defensive sectors see rotation as investors hedge against rate uncertainty.

Industry Highlights
Semiconductors

AI capex cycle accelerating. Demand outpacing supply forecasts through 2026.

Regional Banks

CRE exposure weighing on sentiment. Watch for Q2 earnings guidance revisions.

Drug Manufacturers

GLP-1 pipeline expanding. Sector benefiting from strong clinical trial readouts.

Powered by DAISY · Updated daily before market open
Set & Forget

Never Miss Another Opportunity

Set your criteria once - that's it. We scan 5,000+ stocks every single day so you don't have to. When a stock enters or exits your strategy, you get an email. Zero effort on your part.

  • Set up once, we do the rest
  • Entry & exit alerts straight to your inbox
  • You'll never need to manually check again
Your Strategies
HelloStocks – Balanced Risk
Holdings: 26Criteria: 7
AI OverviewShow Criteria
TickerCompanySectorCriteria
NVDANVIDIA CorpTech7/7
GOOGLAlphabet IncTech7/7
MSFTMicrosoft CorpTech7/7
AMZNAmazon.comConsumer7/7
TSMTaiwan SemiTech7/7
Updated daily after market close
July Offer

Start With 14 Days Free

Use the full platform for two weeks. Build a strategy, research stocks, and see if HelloStocks helps you make better investing decisions.

Two weeks to try everything

"I love it, our users love it. I'm so confident you'll feel the same way that you can cancel with no charge if you don't"

- Charles, Founder

Choose Your Plan

Join hundreds of investors who've transformed their approach to finding quality stocks.

BEST VALUE

Annual Plan

$596$499/year

Save $97 with Annual

July Offer: 14-Day Trial,No Charge Today
🎯

Find quality stocks in minutes

Not hours of manual research

🧠

Know exactly what you're buying

Every metric scored, ranked & explained

AI analysis you won't find anywhere else

Earnings calls, sector outlooks & stock deep-dives

Never miss an opportunity

Daily alerts when stocks match your criteria

🛡️

Avoid costly mistakes

Red flags spotted automatically

14-Day Trial, No Charge Today

Only for July. Start your 14 days free today.

Join hundreds of Super Investors
Distills a lot of information into a simple framework focussed on what works.

Phil

User since Oct 2025
For me, this has greatly reduced the time it takes to analyze stocks, and the information is greatly enhanced from the prior tools that I have used.

Mark

User since Feb 2026
I am learning new aspects of investing every week and HelloStocks is helping that journey immensely.

Simon

User since Oct 2025
The app is clean and easy to use but powerful. You can quickly get company metrics and then dive deeper into them.

Gordon

User since Oct 2025
I love the stock analysis page, I think it's the best feature and makes a perfect combo with the strategy creator for finding stocks with amazing potential and assessing them.

Pit

User since Mar 2026
I use this site every day and for all my investment decisions. Highly recommended!

Kevin

User since Oct 2025

Common Questions

What if I'm new to investing?

Perfect. Our strategy templates and AI assistant help you build a system even if you're just getting started.

How is this different from free screeners?

The free screener is for learning. This is for investing. 9x more stocks with AI, earnings auditing, deep analysis & custom strategies.

How does the trial work?

You are not charged for 14 days and if you cancel before then, you pay nothing. You can cancel from your account settings, no hoops, no hassle.

Questions & Answers

Got Questions?

Absolutely. That's exactly why we built strategy templates and the AI strategy builder (DAISY). You can start with our proven templates, ask DAISY to create something for you, or tweak them to match your preferences. You don't need to come in with a strategy - we help you build one.

Still have questions? Email me directly

Get Started
14-Day Risk-Free Trial

Invest With a System That Shows Its Work

Score any US stock, read the reasoning behind the number, and check our live track record whenever you like. Try everything free for 14 days.

5,000+ US StocksPublic Track RecordNo Charge For 14 Days